Tech Tips
Accelerating Decision-Making through Real-Time Insights in Power BI
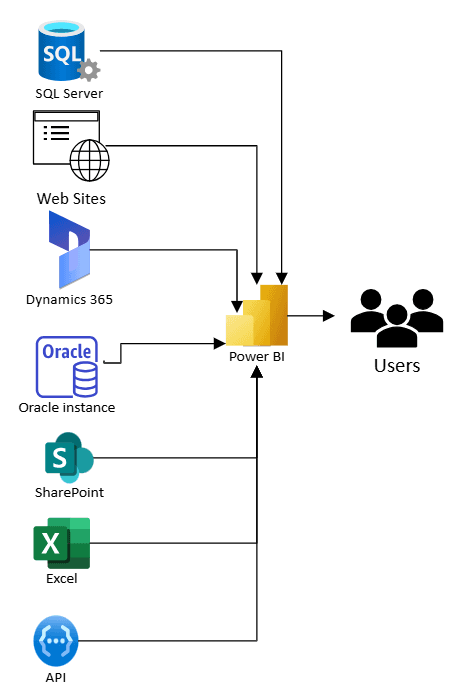
Instead of manually collating spreadsheets, Power BI connects directly to your data sources including Dynamics 365, SQL Server, Excel, and SharePoint; and automatically refreshes data on a defined schedule or in real time.


The Problem with Traditional Reporting

Across many organisations, decision-making still relies on manual reporting cycles built around Excel. At the end of each month, departments gather data from multiple systems, merge it into spreadsheets, and distribute reports to leadership. By the time the information is compiled, reviewed, and shared, it is already out of date.
This delay between data collection and decision-making means that managers are often reacting to last month’s problems rather than addressing today’s challenges. Opportunities to adjust course mid-month are missed, and small issues that could have been fixed early grow into major performance setbacks.
The result is a cycle of reactive management, where data becomes a historical record rather than a live decision-making tool. Teams lose confidence in the accuracy of reports, collaboration suffers, and leaders find themselves making strategic calls without a clear, current picture of the business.

Power BI: Turning Data into Real-Time Insight
Microsoft Power BI replaces outdated reporting methods with a unified, interactive, and real-time view of business performance.
Instead of manually collating spreadsheets, Power BI connects directly to your data sources including Dynamics 365, SQL Server, Excel, and SharePoint; and automatically refreshes data on a defined schedule or in real time.
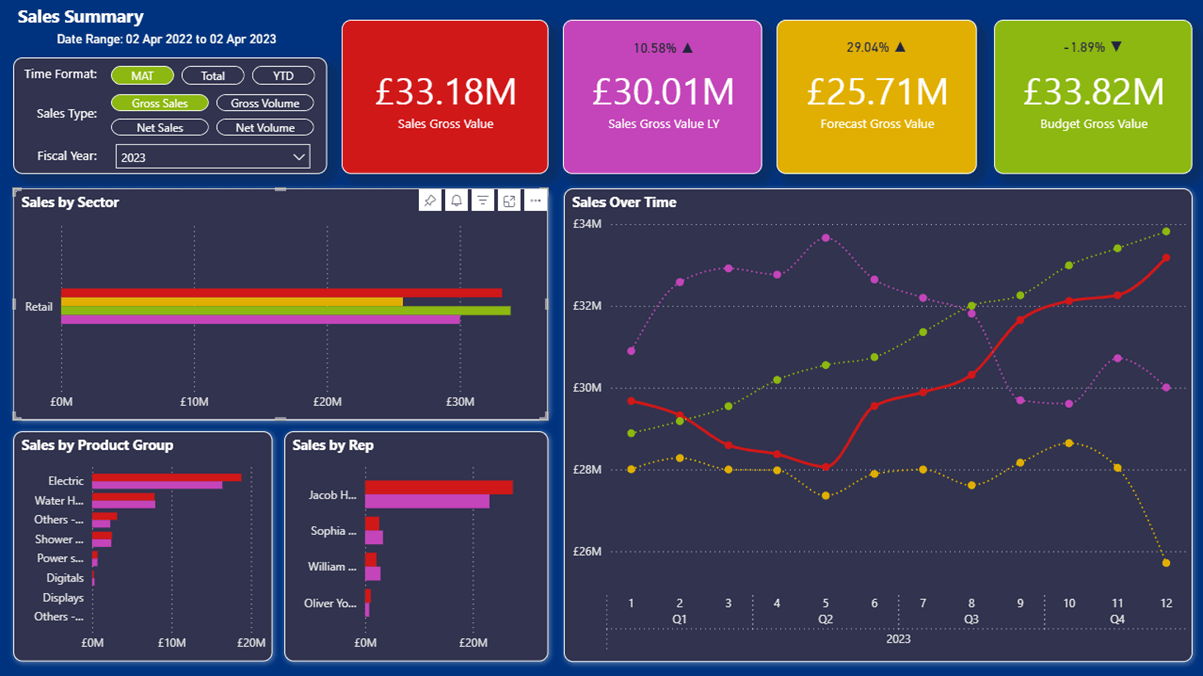
Reports and dashboards update themselves without human intervention, presenting live information in a clear and visual format. Executives and managers can track performance metrics, key trends, and forecasts from any device, at any time. Filters, drill-throughs, and interactive visuals make it possible to explore the story behind the numbers rather than simply viewing them.
Power BI also promotes a culture of shared visibility. Dashboards can be securely shared across departments, so everyone from Finance to Operations is working from the same version of the truth. Decisions become faster, collaboration becomes easier, and insights move from static reports to living, evolving intelligence.
A Day in the Life: Before and After Automation

Before Power BI, department managers spent days compiling data for monthly reports. Each division submitted numbers in a slightly different format, requiring hours of reconciliation. By the time the consolidated report reached leadership, it represented a snapshot of the past, not the present. Decisions were based on lagging indicators, and opportunities for proactive action were often lost.
After Power BI, reporting is instantaneous. The same data that once took days to compile is now available in real time. Managers can view live dashboards showing current performance, customer demand, or project progress. If a metric dips below target, Power BI flags it immediately. Leadership teams can meet with confidence, knowing that every figure is accurate and current.
This shift from manual reporting to live analytics transforms the pace of business. What once required days of preparation now happens in minutes, empowering teams to respond to emerging trends and market conditions in real time.
Governance, Security, and Scalability
Power BI is built within the Microsoft Power Platform and operates securely within the Microsoft 365 environment. Role-based permissions ensure that users see only the data relevant to their responsibilities. Row-Level Security (RLS) can be applied so regional managers see only their territories, while executives have a full organisational view.
Data remains encrypted both in transit and at rest, and every change is logged for auditability. Integration with Dataverse and Azure ensures data consistency across systems, while refresh schedules and performance optimisations maintain reliability even with large datasets.
This combination of security, scalability, and transparency means leaders can trust the numbers and act decisively.
Making the Shift with PTR Associates
Transitioning from static reports to real-time analytics requires more than new software — it takes expertise in data modelling, governance, and change management. That is where PTR Associates can help.
Our consultants and data specialists have extensive experience in implementing Power BI solutions that connect, transform, and visualise business data. We design intuitive dashboards tailored to your organisation’s priorities, ensuring that every stakeholder — from frontline managers to executives — has access to the insights they need.
Beyond implementation, PTR provides training, documentation, and ongoing support to ensure your teams can evolve their reporting as business needs change. Our approach empowers your staff to take ownership of their data, build their own dashboards, and continuously improve decision-making capability.
If you are ready to move from reactive management to proactive, data-driven strategy, contact PTR Associates today. Together we can help you harness the power of real-time insight through Power BI and accelerate your organisation’s ability to act with confidence and agility.
Share This Post
Neil Skipper
Senior Business Intelligence Consultant
A talented business analyst and delivery lead, Neil has over 20 years of experience working with data analytics and business intelligence technologies and platforms.
Frequently Asked Questions
Couldn’t find the answer you were looking for? Feel free to reach out to us! Our team of experts is here to help.
Contact Us


