
Tech Tips
Data Profiling With Power Query
The three Data Profiling tools provided by Power Query provide a really easy to use method of investigating your data to avoid nasty surprises.

Power Query offers three checkbox options for data profiling within the ‘View’ tab.
First, it is important to perform any initial transformation steps to get the data set into a suitable format for profiling. For example:
- Make sure headers are represented as such, to avoid confusion and so the header is not counted as one of the values
- Make sure the profiling runs against the entire dataset rather than the default top 1000 rows to avoid hidden surprises
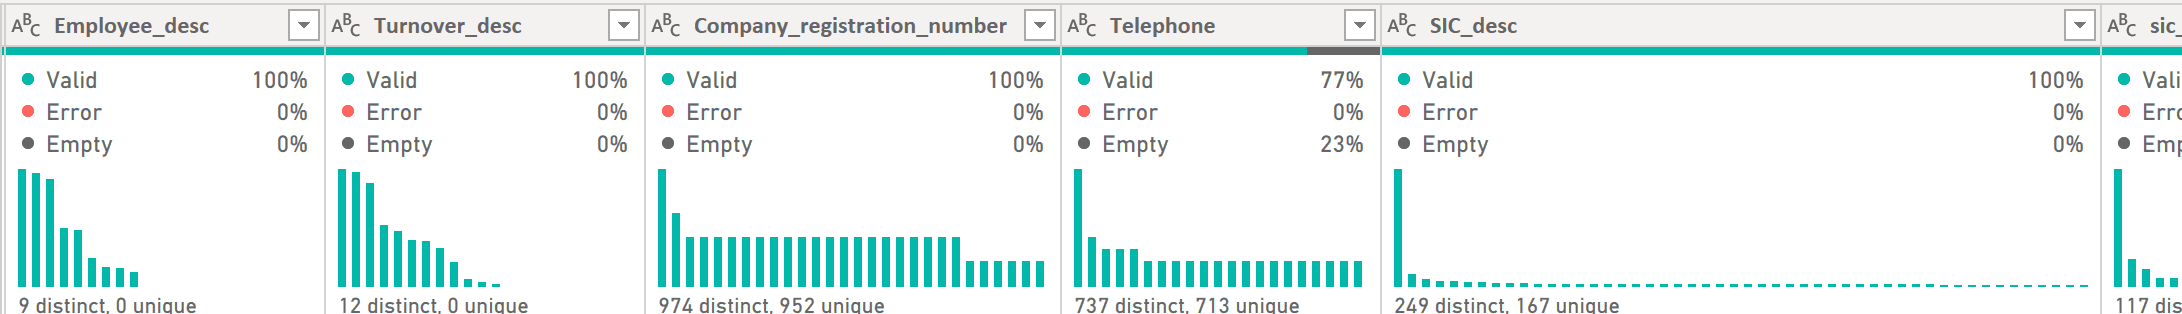
The three options for profiling are as follows:
Column Profile
- The column statistics provided here are very useful: counts of errors and empty values, distinct and unique values
- For numeric data the Min, Max and average can be handy – are these sensible for the dataset in question e.g. if the column lists human ages a max value of 1000 is clearly wrong
- The value distribution chart gives a graphical representation of the values and their frequency. A more visual way of honing into anomalies. For text data this is also useful for spotting typos/ incorrect data
Column distribution
Useful graphical representation of some of the above column statistics:
- Number of distinct values
- Number of unique values. It can be useful to check these values are valid (is it right that there is only one?)
Column quality
- Percentage of values in a column which are valid/errors/empty
- Should we replace the errors?
- Are the empty rows empty across other columns?
DB
David Birch
Business Intelligence Consultant
Dave works with a variety of clients, from start-ups that require advice on setting up their first BI resources, to large and mature businesses, who require collaboration on long-term projects.
Related Articles
Frequently Asked Questions
Couldn’t find the answer you were looking for? Feel free to reach out to us! Our team of experts is here to help.
Contact Us